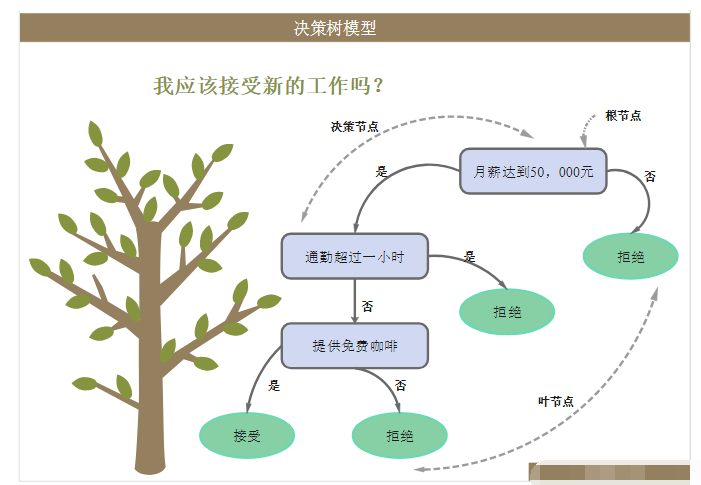
今天,我們介紹機器學習里比較常用的一種分類算法,決策樹。決策樹是對人類認知識別的一種模擬,給你一堆看似雜亂無章的數據,如何用盡可能少的特征,對這些數據進行有效的分類。
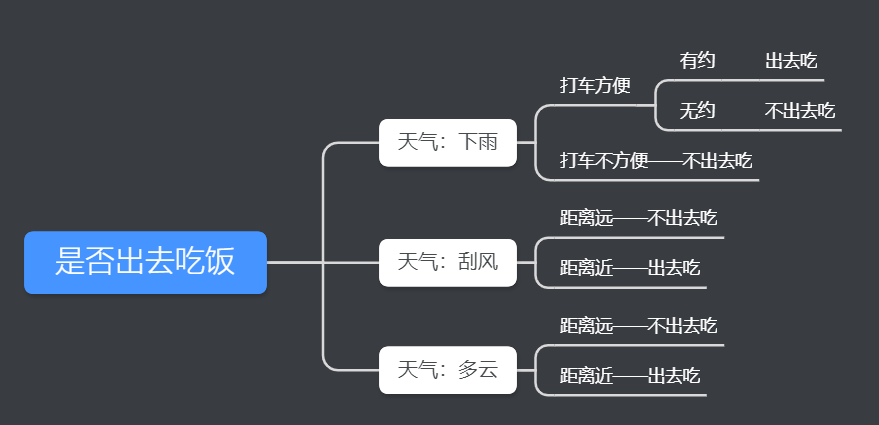
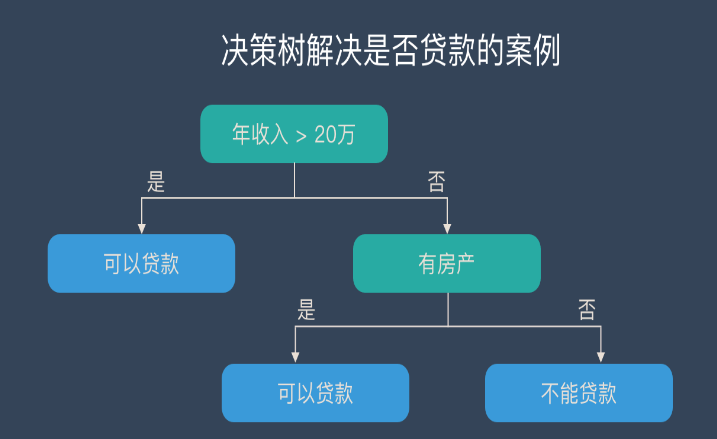
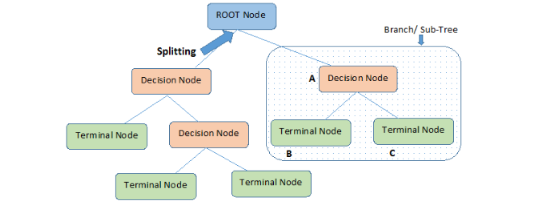
決策樹借助了一種層級分類的概念,每一次都選擇一個區分性最好的特征進行分類,對于可以直接給出標簽 label 的數據,可能最初選擇的幾個特征就能很好地進行區分,有些數據可能需要更多的特征,所以決策樹的深度也就表示了你需要選擇的幾種特征。
在進行特征選擇的時候,常常需要借助信息論的概念,利用最大熵原則。
決策樹一般是用來對離散數據進行分類的,對于連續數據,可以事先對其離散化。
在介紹決策樹之前,我們先簡單的介紹一下信息熵,我們知道,熵的定義為:
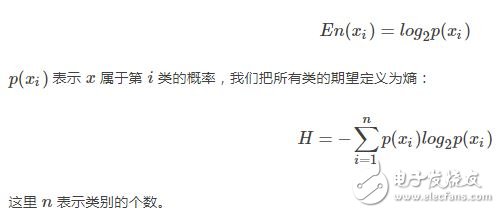
?
我們先構造一些簡單的數據:
from sklearn import datasets
import numpy as np
import matplotlib.pyplot as plt
import math
import operator
def Create_data():
dataset = [[1,1,‘yes’],
[1, 1,‘yes’],
[1, 0, ‘no’],
[0, 1, ‘no’],
[0, 1, ‘no’],
[3, 0, ‘maybe’]]
feat_name = [‘no surfacing’, ‘flippers’]
return dataset, feat_name
然后定義一個計算熵的函數:
def Cal_entrpy(dataset):
n_sample = len(dataset)
n_label = {}
for featvec in dataset:
current_label = featvec[-1]
if current_label not in n_label.keys():
n_label[current_label] = 0
n_label[current_label] += 1
shannonEnt = 0.0
for key in n_label:
prob = float(n_label[key]) / n_sample
shannonEnt -= prob * math.log(prob, 2)
return shannonEnt
要注意的是,熵越大,說明數據的類別越分散,越呈現某種無序的狀態。
下面再定義一個拆分數據集的函數:
def Split_dataset(dataset, axis, value):
retDataSet = []
for featVec in dataset:
if featVec[axis] == value:
reducedFeatVec = featVec[:axis]
reducedFeatVec.extend(featVec[axis+1 :])
retDataSet.append(reducedFeatVec)
return retDataSet
結合前面的幾個函數,我們可以構造一個特征選擇的函數:
def Choose_feature(dataset):
num_sample = len(dataset)
num_feature = len(dataset[0]) - 1
baseEntrpy = Cal_entrpy(dataset)
best_Infogain = 0.0
bestFeat = -1
for i in range (num_feature):
featlist = [example[i] for example in dataset]
uniquValus = set(featlist)
newEntrpy = 0.0
for value in uniquValus:
subData = Split_dataset(dataset, i, value)
prob = len(subData) / float(num_sample)
newEntrpy += prob * Cal_entrpy(subData)
info_gain = baseEntrpy - newEntrpy
if (info_gain 》 best_Infogain):
best_Infogain = info_gain
bestFeat = i
return bestFeat
然后再構造一個投票及計票的函數
def Major_cnt(classlist):
class_num = {}
for vote in classlist:
if vote not in class_num.keys():
class_num[vote] = 0
class_num[vote] += 1
Sort_K = sorted(class_num.iteritems(),
key = operator.itemgetter(1), reverse=True)
return Sort_K[0][0]
有了這些,就可以構造我們需要的決策樹了:
def Create_tree(dataset, featName):
classlist = [example[-1] for example in dataset]
if classlist.count(classlist[0]) == len(classlist):
return classlist[0]
if len(dataset[0]) == 1:
return Major_cnt(classlist)
bestFeat = Choose_feature(dataset)
bestFeatName = featName[bestFeat]
myTree = {bestFeatName: {}}
del(featName[bestFeat])
featValues = [example[bestFeat] for example in dataset]
uniqueVals = set(featValues)
for value in uniqueVals:
subLabels = featName[:]
myTree[bestFeatName][value] = Create_tree(Split_dataset
(dataset, bestFeat, value), subLabels)
return myTree
def Get_numleafs(myTree):
numLeafs = 0
firstStr = myTree.keys()[0]
secondDict = myTree[firstStr]
for key in secondDict.keys():
if type(secondDict[key]).__name__ == ‘dict’ :
numLeafs += Get_numleafs(secondDict[key])
else:
numLeafs += 1
return numLeafs
def Get_treedepth(myTree):
max_depth = 0
firstStr = myTree.keys()[0]
secondDict = myTree[firstStr]
for key in secondDict.keys():
if type(secondDict[key]).__name__ == ‘dict’ :
this_depth = 1 + Get_treedepth(secondDict[key])
else:
this_depth = 1
if this_depth 》 max_depth:
max_depth = this_depth
return max_depth
我們也可以把決策樹繪制出來:
def Plot_node(nodeTxt, centerPt, parentPt, nodeType):
Create_plot.ax1.annotate(nodeTxt, xy=parentPt,
xycoords=‘axes fraction’,
xytext=centerPt, textcoords=‘axes fraction’,
va=“center”, ha=“center”, bbox=nodeType, arrowprops=arrow_args)
def Plot_tree(myTree, parentPt, nodeTxt):
numLeafs = Get_numleafs(myTree)
Get_treedepth(myTree)
firstStr = myTree.keys()[0]
cntrPt = (Plot_tree.xOff + (1.0 + float(numLeafs))/2.0/Plot_tree.totalW,
Plot_tree.yOff)
Plot_midtext(cntrPt, parentPt, nodeTxt)
Plot_node(firstStr, cntrPt, parentPt, decisionNode)
secondDict = myTree[firstStr]
Plot_tree.yOff = Plot_tree.yOff - 1.0/Plot_tree.totalD
for key in secondDict.keys():
if type(secondDict[key]).__name__==‘dict’:
Plot_tree(secondDict[key],cntrPt,str(key))
else:
Plot_tree.xOff = Plot_tree.xOff + 1.0/Plot_tree.totalW
Plot_node(secondDict[key], (Plot_tree.xOff, Plot_tree.yOff),
cntrPt, leafNode)
Plot_midtext((Plot_tree.xOff, Plot_tree.yOff), cntrPt, str(key))
Plot_tree.yOff = Plot_tree.yOff + 1.0/Plot_tree.totalD
def Create_plot (myTree):
fig = plt.figure(1, facecolor = ‘white’)
fig.clf()
axprops = dict(xticks=[], yticks=[])
Create_plot.ax1 = plt.subplot(111, frameon=False, **axprops)
Plot_tree.totalW = float(Get_numleafs(myTree))
Plot_tree.totalD = float(Get_treedepth(myTree))
Plot_tree.xOff = -0.5/Plot_tree.totalW; Plot_tree.yOff = 1.0;
Plot_tree(myTree, (0.5,1.0), ‘’)
plt.show()
def Plot_midtext(cntrPt, parentPt, txtString):
xMid = (parentPt[0] - cntrPt[0]) / 2.0 + cntrPt[0]
yMid = (parentPt[1] - cntrPt[1]) / 2.0 + cntrPt[1]
Create_plot.ax1.text(xMid, yMid, txtString)
def Classify(myTree, featLabels, testVec):
firstStr = myTree.keys()[0]
secondDict = myTree[firstStr]
featIndex = featLabels.index(firstStr)
for key in secondDict.keys():
if testVec[featIndex] == key:
if type(secondDict[key]).__name__ == ‘dict’ :
classLabel = Classify(secondDict[key],featLabels,testVec)
else:
classLabel = secondDict[key]
return classLabel
最后,可以測試我們的構造的決策樹分類器:
decisionNode = dict(boxstyle=“sawtooth”, fc=“0.8”)
leafNode = dict(boxstyle=“round4”, fc=“0.8”)
arrow_args = dict(arrowstyle=“《-”)
myData, featName = Create_data()
S_entrpy = Cal_entrpy(myData)
new_data = Split_dataset(myData, 0, 1)
best_feat = Choose_feature(myData)
myTree = Create_tree(myData, featName[:])
num_leafs = Get_numleafs(myTree)
depth = Get_treedepth(myTree)
Create_plot(myTree)
predict_label = Classify(myTree, featName, [1, 0])
print(“the predict label is: ”, predict_label)
print(“the decision tree is: ”, myTree)
print(“the best feature index is: ”, best_feat)
print(“the new dataset: ”, new_data)
print(“the original dataset: ”, myData)
print(“the feature names are: ”, featName)
print(“the entrpy is:”, S_entrpy)
print(“the number of leafs is: ”, num_leafs)
print(“the dpeth is: ”, depth)
print(“All is well.”)
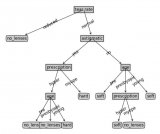
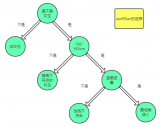
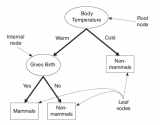
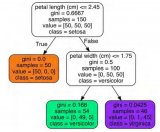
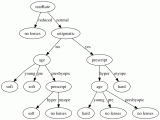
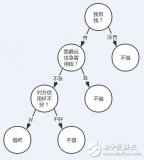
構造的決策樹最后如下所示:
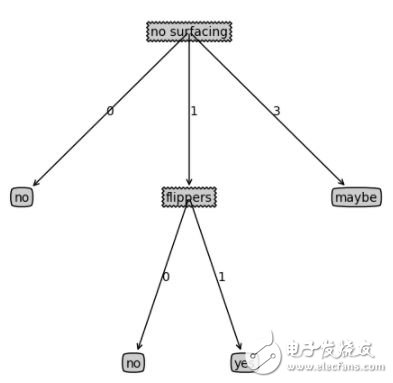
?
 電子發燒友App












評論