由于文章較長,所以我還是先把目錄提前。
一、認識管道流
1.1 數據導入
1.2 使用管道創建工作流
二、K折交叉驗證
2.1 K折交叉驗證原理
2.2 K折交叉驗證實現
三、曲線調參
3.1 模型準確度
3.2繪制學習曲線得到樣本數與準確率的關系
3.3繪制驗證曲線得到超參和準確率關系
四、網格搜索
4.1兩層for循環暴力檢索
4.2構建字典暴力檢索
五、嵌套交叉驗證
六、相關評價指標
6.1 混淆矩陣及其實現
6.2 相關評價指標實現
6.3 ROC曲線及其實現
一、認識管道流
今天先介紹一下管道工作流的操作。
“管道工作流”這個概念可能有點陌生,其實可以理解為一個容器,然后把我們需要進行的操作都封裝在這個管道里面進行操作,比如數據標準化、特征降維、主成分分析、模型預測等等,下面還是以一個實例來講解。
1.1 數據導入與預處理
本次我們導入一個二分類數據集 Breast Cancer Wisconsin,它包含569個樣本。首列為主鍵ID,第2列為類別值(M=惡性腫瘤,B=良性腫瘤),第3-32列是實數值的特征。
先導入數據集:
1#導入相關數據集 2importpandasaspd 3importurllib 4try: 5df=pd.read_csv('https://archive.ics.uci.edu/ml/machine-learning-databases' 6'/breast-cancer-wisconsin/wdbc.data',header=None) 7excepturllib.error.URLError: 8df=pd.read_csv('https://raw.githubusercontent.com/rasbt/' 9'python-machine-learning-book/master/code/' 10'datasets/wdbc/wdbc.data',header=None) 11print('rows,columns:',df.shape) 12df.head()

使用我們學習過的LabelEncoder來轉化類別特征:
1fromsklearn.preprocessingimportLabelEncoder 2X=df.loc[:,2:].values 3y=df.loc[:,1].values 4le=LabelEncoder() 5#將目標轉為0-1變量 6y=le.fit_transform(y) 7le.transform(['M','B'])
劃分訓練驗證集:
1##創建訓練集和測試集 2fromsklearn.model_selectionimporttrain_test_split 3X_train,X_test,y_train,y_test= 4train_test_split(X,y,test_size=0.20,random_state=1)
1.2 使用管道創建工作流
很多機器學習算法要求特征取值范圍要相同,因此需要對特征做標準化處理。此外,我們還想將原始的30維度特征壓縮至更少維度,這就需要用到主成分分析,要用PCA來完成,再接著就可以進行logistic回歸預測了。
Pipeline對象接收元組構成的列表作為輸入,每個元組第一個值作為變量名,元組第二個元素是sklearn中的transformer或Estimator。管道中間每一步由sklearn中的transformer構成,最后一步是一個Estimator。
本次數據集中,管道包含兩個中間步驟:StandardScaler和PCA,其都屬于transformer,而邏輯斯蒂回歸分類器屬于Estimator。
本次實例,當管道pipe_lr執行fit方法時:
1)StandardScaler執行fit和transform方法;
2)將轉換后的數據輸入給PCA;
3)PCA同樣執行fit和transform方法;
4)最后數據輸入給LogisticRegression,訓練一個LR模型。
對于管道來說,中間有多少個transformer都可以。管道的工作方式可以用下圖來展示(一定要注意管道執行fit方法,而transformer要執行fit_transform):

上面的代碼實現如下:
1fromsklearn.preprocessingimportStandardScaler#用于進行數據標準化 2fromsklearn.decompositionimportPCA#用于進行特征降維 3fromsklearn.linear_modelimportLogisticRegression#用于模型預測 4fromsklearn.pipelineimportPipeline 5pipe_lr=Pipeline([('scl',StandardScaler()), 6('pca',PCA(n_components=2)), 7('clf',LogisticRegression(random_state=1))]) 8pipe_lr.fit(X_train,y_train) 9print('TestAccuracy:%.3f'%pipe_lr.score(X_test,y_test)) 10y_pred=pipe_lr.predict(X_test)
Test Accuracy: 0.947
二、K折交叉驗證
為什么要評估模型的泛化能力,相信這個大家應該沒有疑惑,一個模型如果性能不好,要么是因為模型過于復雜導致過擬合(高方差),要么是模型過于簡單導致導致欠擬合(高偏差)。如何評估它,用什么數據來評估它,成為了模型評估需要重點考慮的問題。
我們常規做法,就是將數據集劃分為3部分,分別是訓練、測試和驗證,彼此之間的數據不重疊。但,如果我們遇見了數據量不多的時候,這種操作就顯得不太現實,這個時候k折交叉驗證就發揮優勢了。
2.1 K折交叉驗證原理
先不多說,先貼一張原理圖(以10折交叉驗證為例)。

k折交叉驗證步驟:
Step 1:使用不重復抽樣將原始數據隨機分為k份;
Step2:其中k-1份數據用于模型訓練,剩下的那1份數據用于測試模型;
Step 3:重復Step 2k次,得到k個模型和他的評估結果。
Step 4:計算k折交叉驗證結果的平均值作為參數/模型的性能評估。
2.1 K折交叉驗證實現
K折交叉驗證,那么K的取值該如何確認呢?一般我們默認10折,但根據實際情況有所調整。我們要知道,當K很大的時候,你需要訓練的模型就會很多,這樣子對效率影響較大,而且每個模型的訓練集都差不多,效果也差不多。我們常用的K值在5~12。
我們根據k折交叉驗證的原理步驟,在sklearn中進行10折交叉驗證的代碼實現:
1importnumpyasnp 2fromsklearn.model_selectionimportStratifiedKFold 3kfold=StratifiedKFold(n_splits=10, 4random_state=1).split(X_train,y_train) 5scores=[] 6fork,(train,test)inenumerate(kfold): 7pipe_lr.fit(X_train[train],y_train[train]) 8score=pipe_lr.score(X_train[test],y_train[test]) 9scores.append(score) 10print('Fold:%s,Classdist.:%s,Acc:%.3f'%(k+1, 11np.bincount(y_train[train]),score)) 12print(' CVaccuracy:%.3f+/-%.3f'%(np.mean(scores),np.std(scores)))
output:

當然,實際使用的時候沒必要這樣子寫,sklearn已經有現成封裝好的方法,直接調用即可。
1fromsklearn.model_selectionimportcross_val_score 2scores=cross_val_score(estimator=pipe_lr, 3X=X_train, 4y=y_train, 5cv=10, 6n_jobs=1) 7print('CVaccuracyscores:%s'%scores) 8print('CVaccuracy:%.3f+/-%.3f'%(np.mean(scores),np.std(scores)))
三、曲線調參
我們講到的曲線,具體指的是學習曲線(learning curve)和驗證曲線(validation curve)。
3.1 模型準確率(Accuracy)
模型準確率反饋了模型的效果,大家看下圖:

1)左上角子的模型偏差很高。它的訓練集和驗證集準確率都很低,很可能是欠擬合。解決欠擬合的方法就是增加模型參數,比如,構建更多的特征,減小正則項。
2)右上角子的模型方差很高,表現就是訓練集和驗證集準確率相差太多。解決過擬合的方法有增大訓練集或者降低模型復雜度,比如增大正則項,或者通過特征選擇減少特征數。
3)右下角的模型就很好。
3.2 繪制學習曲線得到樣本數與準確率的關系
直接上代碼:
1importmatplotlib.pyplotasplt 2fromsklearn.model_selectionimportlearning_curve 3pipe_lr=Pipeline([('scl',StandardScaler()), 4('clf',LogisticRegression(penalty='l2',random_state=0))]) 5train_sizes,train_scores,test_scores= 6learning_curve(estimator=pipe_lr, 7X=X_train, 8y=y_train, 9train_sizes=np.linspace(0.1,1.0,10),#在0.1和1間線性的取10個值 10cv=10, 11n_jobs=1) 12train_mean=np.mean(train_scores,axis=1) 13train_std=np.std(train_scores,axis=1) 14test_mean=np.mean(test_scores,axis=1) 15test_std=np.std(test_scores,axis=1) 16plt.plot(train_sizes,train_mean, 17color='blue',marker='o', 18markersize=5,label='trainingaccuracy') 19plt.fill_between(train_sizes, 20train_mean+train_std, 21train_mean-train_std, 22alpha=0.15,color='blue') 23plt.plot(train_sizes,test_mean, 24color='green',linestyle='--', 25marker='s',markersize=5, 26label='validationaccuracy') 27plt.fill_between(train_sizes, 28test_mean+test_std, 29test_mean-test_std, 30alpha=0.15,color='green') 31plt.grid() 32plt.xlabel('Numberoftrainingsamples') 33plt.ylabel('Accuracy') 34plt.legend(loc='lowerright') 35plt.ylim([0.8,1.0]) 36plt.tight_layout() 37plt.show()
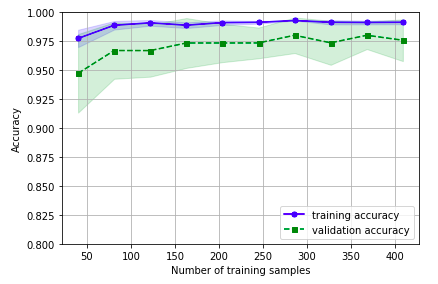
Learning_curve中的train_sizes參數控制產生學習曲線的訓練樣本的絕對/相對數量,此處,我們設置的train_sizes=np.linspace(0.1, 1.0, 10),將訓練集大小劃分為10個相等的區間,在0.1和1之間線性的取10個值。learning_curve默認使用分層k折交叉驗證計算交叉驗證的準確率,我們通過cv設置k。
下圖可以看到,模型在測試集表現很好,不過訓練集和測試集的準確率還是有一段小間隔,可能是模型有點過擬合。
3.3 繪制驗證曲線得到超參和準確率關系
驗證曲線是用來提高模型的性能,驗證曲線和學習曲線很相近,不同的是這里畫出的是不同參數下模型的準確率而不是不同訓練集大小下的準確率:
1fromsklearn.model_selectionimportvalidation_curve 2param_range=[0.001,0.01,0.1,1.0,10.0,100.0] 3train_scores,test_scores=validation_curve( 4estimator=pipe_lr, 5X=X_train, 6y=y_train, 7param_name='clf__C', 8param_range=param_range, 9cv=10) 10train_mean=np.mean(train_scores,axis=1) 11train_std=np.std(train_scores,axis=1) 12test_mean=np.mean(test_scores,axis=1) 13test_std=np.std(test_scores,axis=1) 14plt.plot(param_range,train_mean, 15color='blue',marker='o', 16markersize=5,label='trainingaccuracy') 17plt.fill_between(param_range,train_mean+train_std, 18train_mean-train_std,alpha=0.15, 19color='blue') 20plt.plot(param_range,test_mean, 21color='green',linestyle='--', 22marker='s',markersize=5, 23label='validationaccuracy') 24plt.fill_between(param_range, 25test_mean+test_std, 26test_mean-test_std, 27alpha=0.15,color='green') 28plt.grid() 29plt.xscale('log') 30plt.legend(loc='lowerright') 31plt.xlabel('ParameterC') 32plt.ylabel('Accuracy') 33plt.ylim([0.8,1.0]) 34plt.tight_layout() 35plt.show()
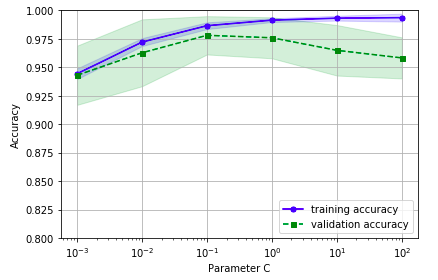
我們得到了參數C的驗證曲線。和learning_curve方法很像,validation_curve方法使用采樣k折交叉驗證來評估模型的性能。在validation_curve內部,我們設定了用來評估的參數(這里我們設置C作為觀測)。
從下圖可以看出,最好的C值是0.1。
四、網格搜索
網格搜索(grid search),作為調參很常用的方法,這邊還是要簡單介紹一下。
在我們的機器學習算法中,有一類參數,需要人工進行設定,我們稱之為“超參”,也就是算法中的參數,比如學習率、正則項系數或者決策樹的深度等。
網格搜索就是要找到一個最優的參數,從而使得模型的效果最佳,而它實現的原理其實就是暴力搜索;即我們事先為每個參數設定一組值,然后窮舉各種參數組合,找到最好的那一組。
4.1. 兩層for循環暴力檢索
網格搜索的結果獲得了指定的最優參數值,c為100,gamma為0.001
1#naivegridsearchimplementation 2fromsklearn.datasetsimportload_iris 3fromsklearn.svmimportSVC 4fromsklearn.model_selectionimporttrain_test_split 5iris=load_iris() 6X_train,X_test,y_train,y_test=train_test_split(iris.data,iris.target,random_state=0) 7print("Sizeoftrainingset:%dsizeoftestset:%d"%(X_train.shape[0],X_test.shape[0])) 8best_score=0 9forgammain[0.001,0.01,0.1,1,10,100]: 10forCin[0.001,0.01,0.1,1,10,100]: 11#foreachcombinationofparameters 12#trainanSVC 13svm=SVC(gamma=gamma,C=C) 14svm.fit(X_train,y_train) 15#evaluatetheSVConthetestset 16score=svm.score(X_test,y_test) 17#ifwegotabetterscore,storethescoreandparameters 18ifscore>best_score: 19best_score=score 20best_parameters={'C':C,'gamma':gamma} 21print("bestscore:",best_score) 22print("bestparameters:",best_parameters)
output: Size of training set: 112 size of test set: 38 best score: 0.973684210526 best parameters: {'C': 100, 'gamma': 0.001}
4.2. 構建字典暴力檢索
網格搜索的結果獲得了指定的最優參數值,c為1
1fromsklearn.svmimportSVC 2fromsklearn.model_selectionimportGridSearchCV 3pipe_svc=Pipeline([('scl',StandardScaler()), 4('clf',SVC(random_state=1))]) 5param_range=[0.0001,0.001,0.01,0.1,1.0,10.0,100.0,1000.0] 6param_grid=[{'clf__C':param_range, 7'clf__kernel':['linear']}, 8{'clf__C':param_range, 9'clf__gamma':param_range, 10'clf__kernel':['rbf']}] 11gs=GridSearchCV(estimator=pipe_svc, 12param_grid=param_grid, 13scoring='accuracy', 14cv=10, 15n_jobs=-1) 16gs=gs.fit(X_train,y_train) 17print(gs.best_score_) 18print(gs.best_params_)
output: 0.978021978022 {'clf__C': 0.1, 'clf__kernel': 'linear'}
GridSearchCV中param_grid參數是字典構成的列表。對于線性SVM,我們只評估參數C;對于RBF核SVM,我們評估C和gamma。最后, 我們通過best_parmas_得到最優參數組合。
接著,我們直接利用最優參數建模(best_estimator_):
1clf=gs.best_estimator_ 2clf.fit(X_train,y_train) 3print('Testaccuracy:%.3f'%clf.score(X_test,y_test))
網格搜索雖然不錯,但是窮舉過于耗時,sklearn中還實現了隨機搜索,使用 RandomizedSearchCV類,隨機采樣出不同的參數組合。
五、嵌套交叉驗證
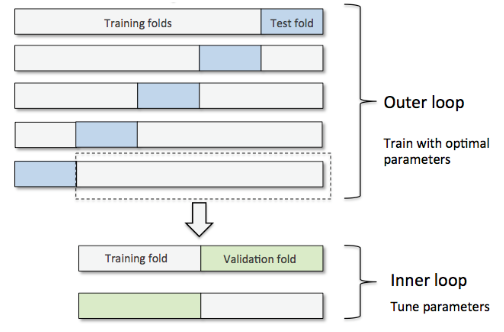
嵌套交叉驗證(nested cross validation)選擇算法(外循環通過k折等進行參數優化,內循環使用交叉驗證),對特定數據集進行模型選擇。Varma和Simon在論文Bias in Error Estimation When Using Cross-validation for Model Selection中指出使用嵌套交叉驗證得到的測試集誤差幾乎就是真實誤差。
嵌套交叉驗證外部有一個k折交叉驗證將數據分為訓練集和測試集,內部交叉驗證用于選擇模型算法。
下圖演示了一個5折外層交叉沿則和2折內部交叉驗證組成的嵌套交叉驗證,也被稱為5*2交叉驗證:
我們還是用到之前的數據集,相關包的導入操作這里就省略了。
SVM分類器的預測準確率代碼實現:
1gs=GridSearchCV(estimator=pipe_svc, 2param_grid=param_grid, 3scoring='accuracy', 4cv=2) 5 6#Note:Optionally,youcouldusecv=2 7#intheGridSearchCVabovetoproduce 8#the5x2nestedCVthatisshowninthefigure. 9 10scores=cross_val_score(gs,X_train,y_train,scoring='accuracy',cv=5) 11print('CVaccuracy:%.3f+/-%.3f'%(np.mean(scores),np.std(scores)))
CV accuracy: 0.965 +/- 0.025
決策樹分類器的預測準確率代碼實現:
1fromsklearn.treeimportDecisionTreeClassifier 2 3gs=GridSearchCV(estimator=DecisionTreeClassifier(random_state=0), 4param_grid=[{'max_depth':[1,2,3,4,5,6,7,None]}], 5scoring='accuracy', 6cv=2) 7scores=cross_val_score(gs,X_train,y_train,scoring='accuracy',cv=5) 8print('CVaccuracy:%.3f+/-%.3f'%(np.mean(scores),np.std(scores)))
CV accuracy: 0.921 +/- 0.029
六、相關評價指標
6.1 混淆矩陣及其實現
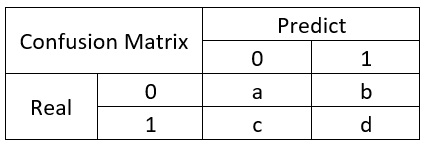
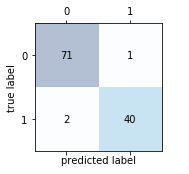
混淆矩陣,大家應該都有聽說過,大致就是長下面這樣子的:

所以,有幾個概念需要先說明:
TP(True Positive): 真實為0,預測也為0
FN(False Negative): 真實為0,預測為1
FP(False Positive): 真實為1,預測為0
TN(True Negative): 真實為1,預測也為1
所以,衍生了幾個常用的指標:

: 分類模型總體判斷的準確率(包括了所有class的總體準確率)
 : 預測為0的準確率

: 真實為0的準確率
 : 真實為1的準確率

: 預測為1的準確率

:對于某個分類,綜合了Precision和Recall的一個判斷指標,F1-Score的值是從0到1的,1是最好,0是最差

: 另外一個綜合Precision和Recall的標準,F1-Score的變形
再舉個例子:

混淆矩陣網絡上有很多文章,也不用說刻意地去背去記,需要的時候百度一下你就知道,混淆矩陣實現代碼:
1fromsklearn.metricsimportconfusion_matrix 2 3pipe_svc.fit(X_train,y_train) 4y_pred=pipe_svc.predict(X_test) 5confmat=confusion_matrix(y_true=y_test,y_pred=y_pred) 6print(confmat)
output: [[71 1] [ 2 40]]
1fig,ax=plt.subplots(figsize=(2.5,2.5)) 2ax.matshow(confmat,cmap=plt.cm.Blues,alpha=0.3) 3foriinrange(confmat.shape[0]): 4forjinrange(confmat.shape[1]): 5ax.text(x=j,y=i,s=confmat[i,j],va='center',ha='center') 6 7plt.xlabel('predictedlabel') 8plt.ylabel('truelabel') 9 10plt.tight_layout() 11plt.show()
6.2 相關評價指標實現
分別是準確度、recall以及F1指標的實現。
1fromsklearn.metricsimportprecision_score,recall_score,f1_score 2 3print('Precision:%.3f'%precision_score(y_true=y_test,y_pred=y_pred)) 4print('Recall:%.3f'%recall_score(y_true=y_test,y_pred=y_pred)) 5print('F1:%.3f'%f1_score(y_true=y_test,y_pred=y_pred))
Precision: 0.976 Recall: 0.952 F1: 0.964
指定評價指標自動選出最優模型:
可以通過在make_scorer中設定參數,確定需要用來評價的指標(這里用了fl_score),這個函數可以直接輸出結果。
1fromsklearn.metricsimportmake_scorer 2 3scorer=make_scorer(f1_score,pos_label=0) 4 5c_gamma_range=[0.01,0.1,1.0,10.0] 6 7param_grid=[{'clf__C':c_gamma_range, 8'clf__kernel':['linear']}, 9{'clf__C':c_gamma_range, 10'clf__gamma':c_gamma_range, 11'clf__kernel':['rbf']}] 12 13gs=GridSearchCV(estimator=pipe_svc, 14param_grid=param_grid, 15scoring=scorer, 16cv=10, 17n_jobs=-1) 18gs=gs.fit(X_train,y_train) 19print(gs.best_score_) 20print(gs.best_params_)
0.982798668208 {'clf__C': 0.1, 'clf__kernel': 'linear'}
6.3 ROC曲線及其實現
如果需要理解ROC曲線,那你就需要先了解一下混淆矩陣了,具體的內容可以查看一下之前的文章,這里重點引入2個概念:

真正率(true positive rate,TPR),指的是被模型正確預測的正樣本的比例:

假正率(false positive rate,FPR) ,指的是被模型錯誤預測的正樣本的比例:

ROC曲線概念:
ROC(receiver operating characteristic)接受者操作特征,其顯示的是分類器的真正率和假正率之間的關系,如下圖所示:
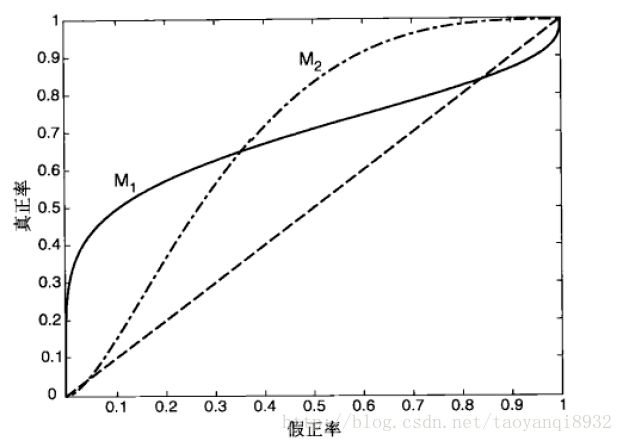
ROC曲線有助于比較不同分類器的相對性能,其曲線下方的面積為AUC(area under curve),其面積越大則分類的性能越好,理想的分類器auc=1。
ROC曲線繪制:
對于一個特定的分類器和測試數據集,顯然只能得到一個分類結果,即一組FPR和TPR結果,而要得到一個曲線,我們實際上需要一系列FPR和TPR的值。
那么如何處理?很簡單,我們可以根據模型預測的概率值,并且設置不同的閾值來獲得不同的預測結果。什么意思?
比如說:
5個樣本,真實的target(目標標簽)是y=c(1,1,0,0,1)
模型分類器將預測樣本為1的概率p=c(0.5,0.6,0.55,0.4,0.7)
我們需要選定閾值才能把概率轉化為類別,
如果我們選定閾值為0.1,那么5個樣本被分進1的類別
如果選定0.3,結果仍然一樣
如果選了0.45作為閾值,那么只有樣本4被分進0
之后把所有得到的所有分類結果計算FTR,PTR,并繪制成線,就可以得到ROC曲線了,當threshold(閾值)取值越多,ROC曲線越平滑。
ROC曲線代碼實現:
1fromsklearn.metricsimportroc_curve,auc 2fromscipyimportinterp 3 4pipe_lr=Pipeline([('scl',StandardScaler()), 5('pca',PCA(n_components=2)), 6('clf',LogisticRegression(penalty='l2', 7random_state=0, 8C=100.0))]) 9 10X_train2=X_train[:,[4,14]] 11 # 因為全部特征丟進去的話,預測效果太好,畫ROC曲線不好看哈哈哈,所以只是取了2個特征 12 13 14cv=list(StratifiedKFold(n_splits=3, 15random_state=1).split(X_train,y_train)) 16 17fig=plt.figure(figsize=(7,5)) 18 19mean_tpr=0.0 20mean_fpr=np.linspace(0,1,100) 21all_tpr=[] 22 23fori,(train,test)inenumerate(cv): 24probas=pipe_lr.fit(X_train2[train], 25y_train[train]).predict_proba(X_train2[test]) 26 27fpr,tpr,thresholds=roc_curve(y_train[test], 28probas[:,1], 29pos_label=1) 30mean_tpr+=interp(mean_fpr,fpr,tpr) 31mean_tpr[0]=0.0 32roc_auc=auc(fpr,tpr) 33plt.plot(fpr, 34tpr, 35lw=1, 36label='ROCfold%d(area=%0.2f)' 37%(i+1,roc_auc)) 38 39plt.plot([0,1], 40[0,1], 41linestyle='--', 42color=(0.6,0.6,0.6), 43label='randomguessing') 44 45mean_tpr/=len(cv) 46mean_tpr[-1]=1.0 47mean_auc=auc(mean_fpr,mean_tpr) 48plt.plot(mean_fpr,mean_tpr,'k--', 49label='meanROC(area=%0.2f)'%mean_auc,lw=2) 50plt.plot([0,0,1], 51[0,1,1], 52lw=2, 53linestyle=':', 54color='black', 55label='perfectperformance') 56 57plt.xlim([-0.05,1.05]) 58plt.ylim([-0.05,1.05]) 59plt.xlabel('falsepositiverate') 60plt.ylabel('truepositiverate') 61plt.title('ReceiverOperatorCharacteristic') 62plt.legend(loc="lowerright") 63 64plt.tight_layout() 65plt.show()
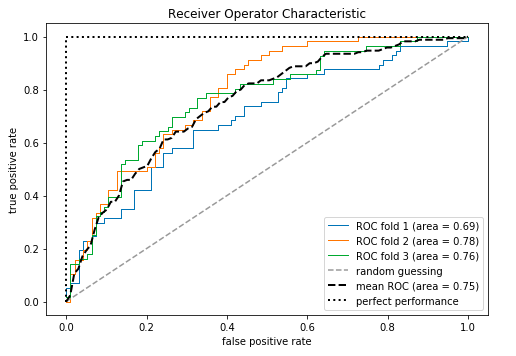
查看下AUC和準確率的結果:
1pipe_lr=pipe_lr.fit(X_train2,y_train) 2y_labels=pipe_lr.predict(X_test[:,[4,14]]) 3y_probas=pipe_lr.predict_proba(X_test[:,[4,14]])[:,1] 4#notethatweuseprobabilitiesforroc_auc 5#the`[:,1]`selectsthepositiveclasslabelonly
1fromsklearn.metricsimportroc_auc_score,accuracy_score 2print('ROCAUC:%.3f'%roc_auc_score(y_true=y_test,y_score=y_probas)) 3print('Accuracy:%.3f'%accuracy_score(y_true=y_test,y_pred=y_labels))
ROC AUC: 0.752 Accuracy: 0.711
責任編輯:xj
原文標題:萬字長文總結機器學習的模型評估與調參,附代碼下載
文章出處:【微信公眾號:人工智能與大數據技術】歡迎添加關注!文章轉載請注明出處。
-
機器學習
+關注
關注
66文章
8437瀏覽量
132897 -
嵌套
+關注
關注
0文章
15瀏覽量
7941
原文標題:萬字長文總結機器學習的模型評估與調參,附代碼下載
文章出處:【微信號:TheBigData1024,微信公眾號:人工智能與大數據技術】歡迎添加關注!文章轉載請注明出處。
發布評論請先 登錄
相關推薦
cmp在機器學習中的作用 如何使用cmp進行數據對比
LSTM神經網絡的調參技巧
AI大模型與深度學習的關系
AI大模型與傳統機器學習的區別
【《大語言模型應用指南》閱讀體驗】+ 基礎知識學習
【《大語言模型應用指南》閱讀體驗】+ 俯瞰全書
機器學習中的數據分割方法
Al大模型機器人
手把手教學!HLK-LD2410B/C新手必看攻略!測試教程、模塊調參一文詳解~


 結機器學習的模型評估與調參大法 想學的快上車


評論