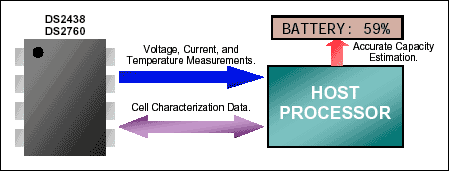
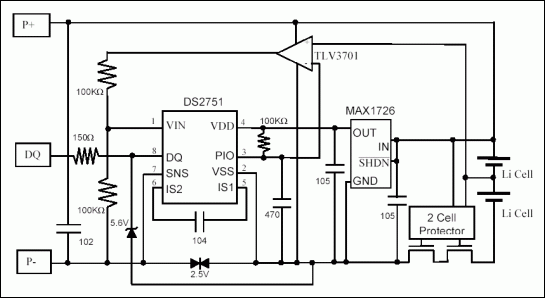
Figure 1. System diagram.
Introduction
Determining the remaining charge of a Lithium-Ion cell accurately under real world conditions requires much more than just coulomb counting. The DS2438's integrated current accumulator (ICA) provides an accurate measurement of cell capacity under known conditions, however in applications where temperature and discharge rates vary and the cell's capacity degrades with aging, the DS2438's ICA needs to be adjusted to achieve the desired accuracy. This document shows how the fuel-gauging concept of the DS2438 can be expanded to insure greater accuracy under extreme operating conditions. This is accomplished by characterizing cell capacity over temperature and rate and controlling the coulomb count in software. This process is not limited to just the DS2438 or a specific type of Lithium-Ion cell. Any Maxim Battery Management device with a coulomb counter, temperature converter and 15 bytes of user EEPROM, such as the DS2760 High Precision Li-Ion Battery Monitor is capable of performing high accuracy fuel gauging on any type of Lithium-Ion cell.Lithium-Ion Cell Behavior
To understand why coulomb counting alone is not sufficient for high accuracy fuel gauging it is helpful to see how its environment affects a Lithium-Ion cell's charge capacity. The cell in the examples below is a 1200mAH rated 4/3A cylindrical. It was charged by a two step method, first by a constant 1C rate until the cell voltage reached 4.2 volts, then by a constant voltage until the charge current fell below C/20 or 60mA. At this point it was considered fully charged. It was discharged either at a high current rate of 1C or a low current rate of 0.2C. The cell was considered to be fully discharged when its voltage fell below 2.5 volts.Temperature & Discharge Rate
The capacity of the Lithium-Ion cell varies greatly depending on the temperature and discharge rate. Figure 2 shows its charge capacity in milliamp-hours as temperature and discharge rate are changed. The "Full" line on the chart is the point at which the cell is considered fully charged by using the above charging method at the corresponding temperature. The "High Current Empty" line is the point at which the cell is considered fully discharged by a 1C rate at each temperature. The "Low Current Empty" line was plotted in the same manner using a discharge rate of 0.2C.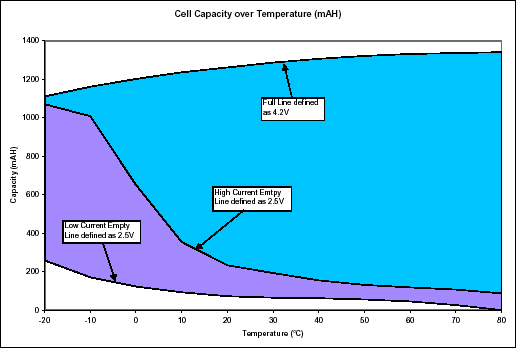
Figure 2.
The capacity of the cell at a given rate and temperature is the difference from the "Full" line and the corresponding "Empty" line. Because both the empty and full points change over temperature and rate, every point on the chart is relative to every other point. For example, if a cell was fully charged at a temperature of 80°C and then fully discharged at the low current rate at -20°C, the amount of charge able to be removed would be the difference between the full value at 80°C (1340mAH) and the low current empty value at -20°C (250mAH) or 1090mAH. If the cell was then fully recharged at -20°C, only the difference between the full and empty values at -20°C or 860mAH could be returned to the cell.
Only the immediate temperature and rate are needed to determine relative full and empty points. A cell that is discharged partially at temperature 1 and rate 1, then discharged completely at temperature 2 and rate 2 will be considered empty at a point based on temperature 2 and rate 2. Similarly, the cell above could be fully discharged at the high current rate yet is able to be further discharged at the low current rate by the number of milliamp-hours between the two "Empty" points that correspond to the present cell temperature. Because of this, it is only necessary to keep track of the present cell temperature and discharge rate when determining remaining capacity.
Cell Aging
As a Lithium-Ion cell ages it loses its ability to store charge. Figure 3 shows the effects of repeatedly charging and discharging the cell at room temperature. By maintaining an ongoing coulomb count of the charge on the cell it can be shown that aging affects the "Full" point only. The "Empty" points remain unchanged. To account for this, the formulas for calculating remaining capacity must be capable of dynamically changing over time to remain accurate.Other Conditions
Most other conditions have little or no effect on charge capacity. Lithium-Ion cells are extremely efficient when charging; very little energy is lost to heat during the cycle unlike other cell chemistries. The self-discharge of a Lithium-Ion cell is extremely low to the point where it is difficult to even measure. Since all these conditions combined affect the coulomb count result less than the accuracy of the measurement device does, they are ignored completely in the fuel gauging equations.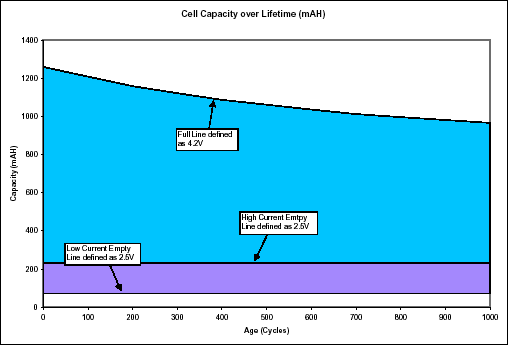
Figure 3.
Calculating Remaining Capacity
From the charts above it is easy to see how a coulomb counting only method can become very inaccurate under real world conditions. This section shows how coulomb counting combined with characterization of the expected "Empty" and "Full" points can maintain an accurate estimation of remaining cell capacity.Standard Assumptions
For the algorithms to function accurately while minimizing computational complexity and parametric data storage, certain assumptions are made. First it is assumed that similar charging efficiencies and termination limits are applied universally to the application. It is also assumed in this example that there are a finite number of repeatable discharge efficiencies encountered, each being well bounded. The cell must always be considered fully discharged at the same voltage level, 2.5 volts for example. Charge efficiency and pack self-discharge are assumed negligible in this application and are ignored.Cell Characterization
The fuel gauging equations work by comparing the DS2438's ICA value with expected "Empty" and "Full" values for that cell type which are stored in the DS2438's user EEPROM. This data is generated by characterization of the cell type over the expected temperature range and current consumption of the application. This information is subsequently stored in a pack resident memory for the algorithms to later extract and modify. Figure 4 shows the system used to collect the characterization data. Information should be gathered on several packs so that average or typical values can be stored in every production pack. For best accuracy, the data should be collected on assembled packs containing the production circuit as opposed to individual cells.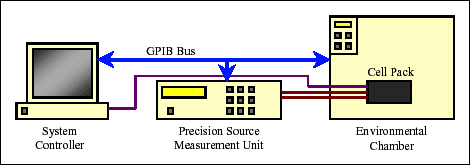
Figure 4. Cell characterization system.
To collect the data, the cell pack is fully charged at each temperature and fully discharged at each rate at each temperature. Figure 5 shows the ICA reading of the DS2438 as full charge data and active current discharge data is collected from 0°C to 40°C. This process would then be extended to collect the standby current discharge data over the same temperature range.
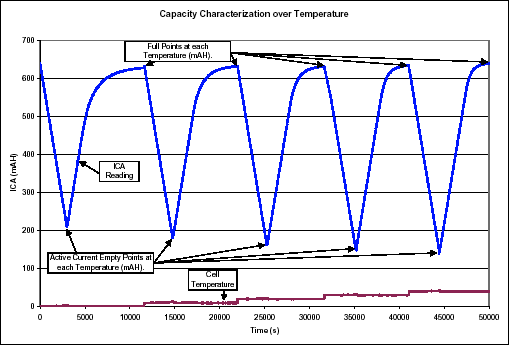
Figure 5.
All collected data points are arranged in Table 1 below. Since only the difference between points is important, the absolute values of the data do not matter, they have been normalized to lowest value (standby current empty at 40°C). This reduces the amount of data needing to be stored since Standby Empty 40°C is now always 0.
Table 1. Cell Characterization Data
| ? | 0°C | 10°C | 20°C | 30°C | 40°C |
| Full (mAH) | 554 | 561 | 578 | 582 | 588 |
| Standby Empty (mAH) | 65 | 42 | 19 | 11 | 0 |
| Active Empty (mAH) | 124 | 90 | 65 | 50 | 44 |
The characterization data is then stored in two pages of the DS2438's EEPROM memory. Because values larger than 25510 require more than 1 byte of memory to store, the amount of data is reduced by storing only the first value and then recording the incremental differences between temperatures. A memory map of the DS2438 data store is shown in Table 2 below.
Table 2. DS2438 Memory Map
| ? | Page 3 | Page 4 |
| 0 | FULL at 0°C | Δ STANDBY EMPTY to 20°C |
| 1 | Δ STANDBY EMPTY to 30°C | |
| 2 | Δ FULL to 10°C | Δ ACTIVE EMPTY to 0°C |
| 3 | Δ FULL to 20°C | Δ ACTIVE EMPTY to 10°C |
| 4 | Δ FULL to 30°C | Δ ACTIVE EMPTY to 20°C |
| 5 | Δ FULL to 40°C | Δ ACTIVE EMPTY to 30°C |
| 6 | Δ STANDBY EMPTY to 0°C | ACTIVE EMPTY at 40°C |
| 7 | Δ STANDBY EMPTY to 10°C | Unused |
The first 6 bytes of page 3 contain the cell's measured FULL point at the different temperatures across the range. Bytes 0-1 are the capacity of the cell at 0°C; the next four bytes are values of the increase in capacity from the previous temperature. For example if a given cell's capacity was 554mAH at 0°C and 561mAH at 10°C then bytes 0-1 would contain 55410 (0x022Ah) and byte 2 would contain 710 (0x07h). The next nine bytes hold the STANDBY EMPTY and ACTIVE EMPTY information stored in the same manner as the FULL values. EMPTY values are incremented in the opposite direction starting at 40°C because it is the lowest value. STANDBY EMPTY at 40°C is not included since it is always 010. Table 3 shows the actual information stored in the DS2438 using the characterization data contained in Table 1 above.
Table 3. Memory map of cell data stored in DS2438
| ? | 0 | 1 | 2 | 3 | 4 | 5 | 6 | 7 |
| Page 3 | 0x02h | 0x2Ah | 0x07h | 0x11h | 0x04h | 0x06h | 0x17h | 0x17h |
| ? | FULL | STANDBY EMPTY | ||||||
| Page 4 | 0x08h | 0x0Bh | 0x22h | 0x19h | 0x0Fh | 0x06h | 0x2Ch | X |
| ? | STANDBY EMPTY | ACTIVE EMPTY | ? | |||||
The Equations
After characterization of the cell pack is complete, calculating remaining capacity is very simple. The characterization data is used to find cell full and empty points based on temperature and discharge rate, and the DS2438's integrated current accumulator is compared against those values to express remaining capacity as a percentage. Upon power-up, the characterization data should be read from the DS2438 and stored in host RAM. When the host decides to update its remaining capacity indicator, it begins the process by reading the cell temperature and the DS2438's ICA. The present full value for the cell is then calculated by linearly interpolating between the FULL characterization data points using the cell temperature. For example, the cell full point at 28°C is calculated by:Full Value (28°C) = (FULL 20°C) + ((28-20)/10) × (FULL 30°C - FULL 20°C)
The empty point is calculated in exactly the same method, except a determination must be made to use the ACTIVE or STANDBY characterization data based on the current activation state of the system. Capacity can then be calculated by determining the location of the ICA between empty and full points as a percentage. The formulas are summarized below:
Full Value = FULL[Temperature]
Empty Value = STANDBY EMPTY[Temperature] or ACTIVE EMPTY[Temperature]
Capacity = ((ICA - Empty Value)/(Full Value - Empty Value)) × 100%
No estimation of remaining capacity is perfect. To prevent a long-term accumulation of error the ICA register should be reset to the corresponding EMPTY value each time the cell is fully drained. Likewise, each time the cell is fully charged, the corresponding FULL value should be changed to match the ICA. By permanently adjusting the full point based on actual operation, the pack is able to adjust for cells that are different from the "typical" characterization data and adjusts as the cell ages and deteriorates.
At End of Discharge: ICA = Empty Value
At End of Full Charge: FULL[Temperature] = ICA
Displaying the Information
The equations above report remaining capacity as a percentage between calculated empty and full points. This might not be appropriate for every application. For example, a cell might be discharged to a level below ACTIVE EMPTY but above STANDBY EMPTY. If the remaining capacity percentage was based off the STANDBY EMPTY point it would show some capacity left even though the cell would not be able to support an active current at that time. This could be very confusing for the end user. The way the host processor presents the capacity data is unique to each application and not covered by standard fuel gauging equations.Remaining Energy Calculation
For some applications estimating the remaining energy is very important. For example if the circuit had constant power dissipation where the active current increased and the cell voltage dropped, remaining time would not be related directly to remaining charge. A good estimation of remaining energy can be easily calculated with a voltage reading from the DS2438 however. Recall the energy equation:Energy (J) = Volts × Current × time
Which can be rewritten in terms of remaining energy:
Remaining Energy (J) = 3.6 × Remaining mAH × RAV
Where:
Remaining mAH are the remaining milliamp-hours calculated by the above equations.
3.6 is the conversion factor from milliamp-hours to amp-seconds.
RAV is the remaining average voltage of the cell explained below.
The upper plot on Figure 6 shows a typical cell discharge curve. The average remaining cell voltage can be approximated at any time by finding the average between the cell voltage currently, and the cell voltage when empty (2.5 volts typically).
RAV = (Voltage + 2.5)/2
The remaining energy calculation can now be summarized as:
Remaining Energy (J) = 3.6 × Remaining mAH × (Voltage + 2.5)/2
Where:
Remaining mAH are the remaining milliamp-hours calculated by the fuel gauging equations.
Voltage is present cell voltage measured by the DS2438.
3.6 is the conversion factor from milliamp-hours to amp-seconds.
The second plot on Figure 6 shows the accuracy for this cell when predicting remaining energy with this method. The more linear a cell's discharge curve is, the more accurate this method will be. The less linear the cell, the less accurate the calculation. In either case, the calculation becomes more accurate where it is most important: as the cell voltage approaches the empty point.
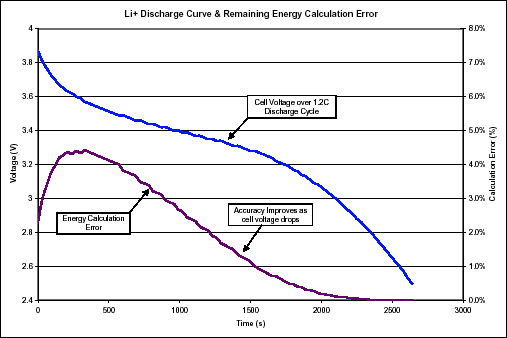
Figure 6.
Example Application
For the following example a DS2438 demo board was used to monitor a 520mAH prismatic Li+ cell. For information on the DS2438 demo board refer to the DS2438K datasheet. A Keithley 2304A DVM/power supply simulated the charger and load for the cell and a Tenney environmental chamber was used to control cell temperature. The cell characterization information and actual data stored in the DS2438 are the same as in the Cell Characterization section above. They are repeated in Tables 4 & 5 below for convenience. The controlling software was written in Visual Basic and sections of the code dealing directly with fuel gauging are presented at the end of this paper.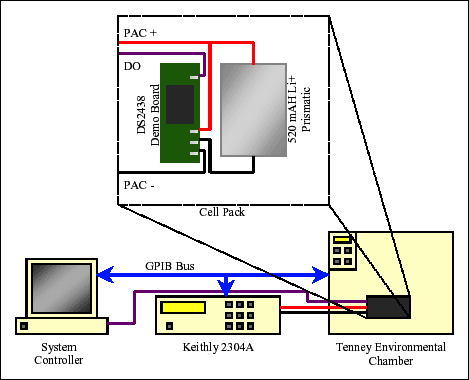
Figure 7. Example application system.
Table 4. Cell Characterization Data
| ? | 0°C | 10°C | 20°C | 30°C | 40°C |
| FULL (mAH) | 554 | 561 | 578 | 582 | 588 |
| STANDBY EMPTY (mAH) | 65 | 42 | 19 | 11 | 0 |
| ACTIVE EMPTY (mAH) | 124 | 90 | 65 | 50 | 44 |
Table 5. Memory map of cell data stored in DS2438
| ? | 0 | 1 | 2 | 3 | 4 | 5 | 6 | 7 |
| Page 3 | 0x02h | 0x2Ah | 0x07h | 0x11h | 0x04h | 0x06h | 0x17h | 0x17h |
| ? | FULL | S. EMPTY | ||||||
| Page 4 | 0x08h | 0x0Bh | 0x22h | 0x19h | 0x0Fh | 0x06h | 0x2Ch | X |
| ? | S. EMPTY | ACTIVE EMPTY | ? | |||||
The cell was subjected to twenty partial charge-discharge cycles over a variety of temperatures from 0°C to 40°C. This test was designed to prove the accuracy of the fuel gauging equations under conditions which are far more extreme than would generally be encountered in a standard commercial application. Figure 8 shows the integrated current accumulator's relationship to the dynamically calculated empty and full points over the duration of the test. The cell temperature is shown at the bottom of the graph. The X-axis Update Cycle units refer to each time the remaining capacity was updated, approximately every 15 seconds. The worst case error occurred during the first charge (around update cycle 1000) and was approximately 3. The fuel gauge algorithms permanently adjusted the full point based on that error and the second time a charge occurred at the same temperature (around update cycle 5500) the ICA matched the expected full level almost exactly.
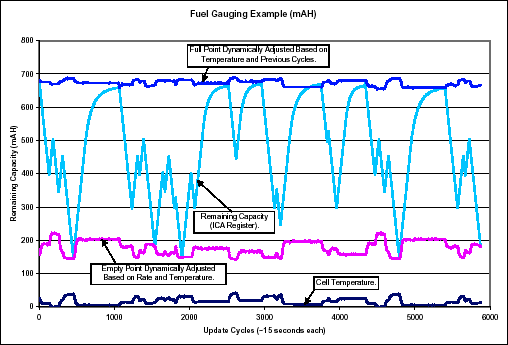
Figure 8.
The software then calculates the remaining capacity as a percentage of the difference between the empty and full points. Figure 9 below shows the actual fuel gauge output from the data shown above.
Summary
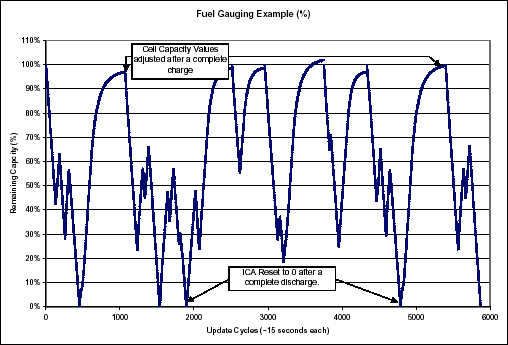
Figure 9.
Considering cell behavior over temperature and discharge rate when calculating remaining cell capacity provides superior accuracy to coulomb counting alone. Maxim's fuel gauging equations can be applied to any Lithium-Ion cell type and any Maxim coulomb counting device while using a minimum of host processor cycles. They also adjust for cell to cell differences and cell aging, becoming more accurate over time.
 電子發(fā)燒友App




評論