Abstract: Implementing a battery fuel gauge can be done in a variety of ways including using voltage measurements or coulomb counting. Although the use of voltage measurement has been a popular method of choice, it does not produce the most accurate results available. This application note studies the voltage-based method of fuel gauging for both Li-Ion and NiMH battery cells. Data is provided that demonstrates the high degree of error introduced when implementing voltage measurement as a fuel gauge method when the battery is subjected to real world conditions of varying temperatures and discharge rates.
Determining the remaining capacity of a cell by simply measuring its voltage level may be less expensive and use less computing power of the host CPU compared to coulomb counting, but under real world conditions, voltage measurements alone can be very misleading. While it is true that a given cell's voltage level will continually drop during discharge, the voltage level's relationship to remaining charge varies greatly over cell temperature and discharge rate. Figure 1 shows a Nickel-Metal Hydride (NiMH) cell's voltage curve during discharge at different temperatures and different discharge rates.
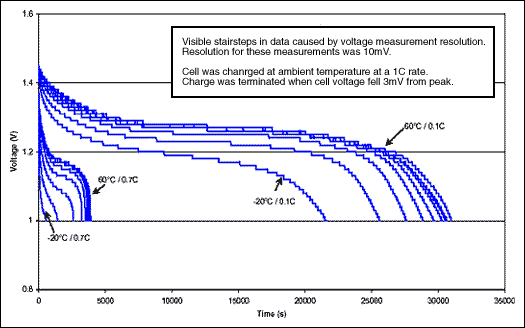
Figure 1. NiMH discharge over temperature (0.1C/0.7C).
The important point made by Figure 1 is the relationship between a cell's voltage and its remaining charge. The remaining charge of the cell in the graph above can be calculated by multiplying its discharge rate by the remaining seconds before being fully discharged. Tables 1 and 2 show the remaining charge values in milliamp-hours versus the cell's voltage. Values for the higher voltage levels are not available for Table 2 because the higher discharge rate immediately lowers the cell's starting voltage level.
Table 1. Remaining NiMH Capacity in mAH vs. Voltage and Temperature (0.1C Discharge Rate)
Table 2: Remaining NiMH Capacity in mAH vs. Voltage and Temperature (0.7C Discharge Rate)
The data in these two tables shows that the remaining capacity of a cell can vary widely for a given measured voltage. Figure 2 shows the maximum percentage change in remaining capacity that was encountered over the indicated temperature range, for a given discharge rate and cell voltage, using the 20°C remaining capacity number as a baseline. This maximum percentage change is the maximum error of a voltage-based fuel gauge over the indicated temperature range. For example, at a cell voltage of 1.2V and a 0.7C discharge rate, the maximum error over -20°C to 60°C is the percentage change from the -20°C number to the 20°C baseline, or (2240.27-404.28)/2240.27 = 82%. The data is separated into 0° to 40° and -20° to 60° temperature ranges to show that even in normal operating conditions the error can be substantial. Notice also that the greater discharge current causes greater error in the measurement.
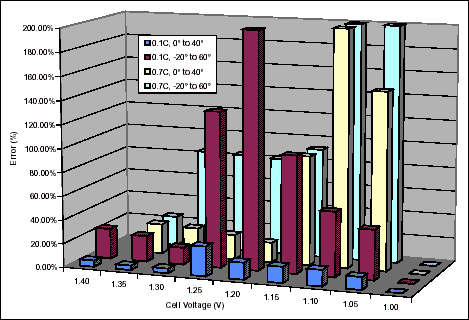
Figure 2. NiMH Maximum error (%) for different discharge rates and temperature ranges.
Similar data for Lithium-Ion (Li+) cells was also collected. The results are shown in the tables and figure below. Note that the nominal capacity of the Lithium-Ion cell was roughly one third that of the Nickel-Metal Hydride cell. The percentage errors for the two cell types are similar.
Table 3. Remaining Li+ Capacity in mAH vs. Voltage and Temperature (0.1C Discharge Rate)
Table 4: Remaining Li+ Capacity in mAH vs. Voltage and Temperature (0.7C Discharge Rate)
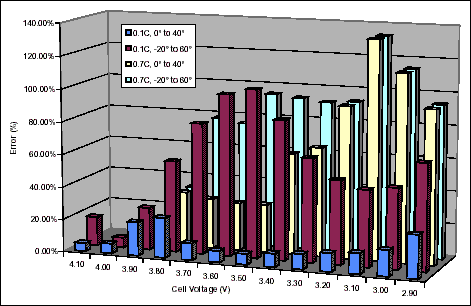
Figure 3. Li+ maximum error (%) for different discharge rates and temperature ranges.
This error can be corrected by the system if the cell's temperature and discharge rate are known. However if those measurements are included, the process becomes more complicated and expensive than a coulomb counting approach and does not provide any significant advantages. Please refer to Dallas Semiconductor's application note AN131 "Li+ Fuel Gauging with Dallas Semiconductor Devices" for information on how to increase the accuracy of Dallas coulomb counting devices even further. Contact Battery Management Marketing for a copy of the document.
Data for this experiment was collected from a 4/3A size Nickel-Metal Hydride cell with a rated capacity of 3500mAH and a 4/3A size Lithium-Ion cell with a rated capacity of 1250mAH. The NiMH cell was charged with a 1C rate at ambient temperature until the cell's voltage fell 3mV from the peak value. The Li+ was charged at a 1C rate until a cell voltage of 4.2 was attained. Charging was completed at a constant 4.2 volts until the charge current fell below C/20 or 70mA. During discharge at various rates and temperatures the cells' voltage levels were recorded at 30-second intervals. The NiMH cell was considered fully discharged at 1.0 volts and the Li+ at 2.5 volts. Measurements were taken with a Keithley 2304A DVM/power supply. The cells' temperature was regulated with a Tenney environmental chamber.
Determining the remaining capacity of a cell by simply measuring its voltage level may be less expensive and use less computing power of the host CPU compared to coulomb counting, but under real world conditions, voltage measurements alone can be very misleading. While it is true that a given cell's voltage level will continually drop during discharge, the voltage level's relationship to remaining charge varies greatly over cell temperature and discharge rate. Figure 1 shows a Nickel-Metal Hydride (NiMH) cell's voltage curve during discharge at different temperatures and different discharge rates.

Figure 1. NiMH discharge over temperature (0.1C/0.7C).
The important point made by Figure 1 is the relationship between a cell's voltage and its remaining charge. The remaining charge of the cell in the graph above can be calculated by multiplying its discharge rate by the remaining seconds before being fully discharged. Tables 1 and 2 show the remaining charge values in milliamp-hours versus the cell's voltage. Values for the higher voltage levels are not available for Table 2 because the higher discharge rate immediately lowers the cell's starting voltage level.
Table 1. Remaining NiMH Capacity in mAH vs. Voltage and Temperature (0.1C Discharge Rate)
| Voltage (V) | Temperature (°C) | ||||||||
| 60 | 50 | 40 | 30 | 20 | 10 | 0 | -10 | -20 | |
| 1.40 | 3418.46 | 3361.71 | 3321.66 | 3271.60 | 3205.04 | 3141.66 | 3031.61 | 2828.14 | 2391.26 |
| 1.35 | 3245.02 | 3181.60 | 3124.88 | 3068.15 | 3011.60 | 2968.23 | 2914.87 | 2761.44 | 2357.90 |
| 1.30 | 2921.51 | 2828.09 | 2754.69 | 2687.96 | 2651.40 | 2641.39 | 2641.39 | 2581.34 | 2271.19 |
| 1.25 | 1177.27 | 1113.89 | 1023.83 | 953.79 | 920.48 | 940.49 | 1150.60 | 2127.77 | 2047.73 |
| 1.20 | 463.57 | 506.92 | 480.24 | 450.22 | 420.22 | 403.54 | 420.22 | 570.29 | 1354.04 |
| 1.15 | 273.47 | 290.14 | 280.14 | 263.46 | 246.79 | 230.12 | 220.12 | 260.13 | 490.26 |
| 1.10 | 146.74 | 170.09 | 166.75 | 156.74 | 146.74 | 136.73 | 130.07 | 143.40 | 226.78 |
| 1.05 | 53.36 | 66.70 | 66.70 | 66.70 | 63.37 | 60.03 | 56.70 | 63.36 | 90.05 |
| 1.00 | 0.00 | 0.00 | 0.00 | 0.00 | 0.00 | 0.00 | 0.00 | 0.00 | 0.00 |
Table 2: Remaining NiMH Capacity in mAH vs. Voltage and Temperature (0.7C Discharge Rate)
| Voltage (V) | Temperature (°C) | ||||||||
| 60 | 50 | 40 | 30 | 20 | 10 | 0 | -10 | -20 | |
| 1.40 | ? | ? | ? | ? | ? | ? | ? | ? | ? |
| 1.35 | ? | ? | ? | 2823.67 | 2706.99 | 2520.30 | 2030.24 | ? | ? |
| 1.30 | 3010.36 | 2940.35 | 2847.01 | 2753.66 | 2636.98 | 2473.63 | 2006.91 | 1096.80 | 420.05 |
| 1.25 | 2823.67 | 2730.33 | 2660.32 | 2566.97 | 2473.63 | 2356.95 | 1960.24 | 1073.47 | 412.28 |
| 1.20 | 2450.29 | 2356.95 | 2286.94 | 2240.27 | 2240.27 | 2170.26 | 1866.89 | 1050.13 | 404.48 |
| 1.15 | 746.75 | 630.07 | 583.40 | 630.07 | 910.11 | 1750.21 | 1633.53 | 956.79 | 396.71 |
| 1.10 | 140.02 | 116.68 | 93.35 | 116.68 | 163.35 | 256.70 | 1003.46 | 746.76 | 350.04 |
| 1.05 | 23.33 | 23.34 | 23.34 | 23.33 | 46.67 | 46.68 | 116.68 | 280.04 | 233.36 |
| 1.00 | 0.00 | 0.00 | 0.00 | 0.00 | 0.00 | 0.00 | 0.00 | 0.00 | 0.00 |
The data in these two tables shows that the remaining capacity of a cell can vary widely for a given measured voltage. Figure 2 shows the maximum percentage change in remaining capacity that was encountered over the indicated temperature range, for a given discharge rate and cell voltage, using the 20°C remaining capacity number as a baseline. This maximum percentage change is the maximum error of a voltage-based fuel gauge over the indicated temperature range. For example, at a cell voltage of 1.2V and a 0.7C discharge rate, the maximum error over -20°C to 60°C is the percentage change from the -20°C number to the 20°C baseline, or (2240.27-404.28)/2240.27 = 82%. The data is separated into 0° to 40° and -20° to 60° temperature ranges to show that even in normal operating conditions the error can be substantial. Notice also that the greater discharge current causes greater error in the measurement.

Figure 2. NiMH Maximum error (%) for different discharge rates and temperature ranges.
Similar data for Lithium-Ion (Li+) cells was also collected. The results are shown in the tables and figure below. Note that the nominal capacity of the Lithium-Ion cell was roughly one third that of the Nickel-Metal Hydride cell. The percentage errors for the two cell types are similar.
Table 3. Remaining Li+ Capacity in mAH vs. Voltage and Temperature (0.1C Discharge Rate)
| Voltage (V) | Temperature (°C) | ||||||||
| 60 | 50 | 40 | 30 | 20 | 10 | 0 | -10 | -20 | |
| 4.1 | 1240.17 | 1216.83 | 1195.83 | 1177.16 | 1157.33 | 1152.66 | 1100.17 | 1004.50 | 953.17 |
| 4.0 | 1053.50 | 1032.49 | 1016.16 | 1007.99 | 1009.17 | 1041.83 | 1069.83 | 1003.33 | 951.25 |
| 3.9 | 824.83 | 801.49 | 786.33 | 780.49 | 789.93 | 842.33 | 952.00 | 994.00 | 949.33 |
| 3.8 | 670.83 | 646.33 | 626.49 | 610.16 | 607.83 | 627.66 | 756.00 | 932.17 | 947.33 |
| 3.7 | 581.00 | 556.49 | 535.49 | 519.16 | 513.33 | 513.33 | 565.83 | 802.67 | 924.00 |
| 3.6 | 505.17 | 480.66 | 460.83 | 444.49 | 436.33 | 432.83 | 466.67 | 632.33 | 866.83 |
| 3.5 | 438.67 | 416.49 | 396.66 | 380.33 | 372.17 | 367.49 | 394.33 | 488.83 | 753.67 |
| 3.4 | 380.33 | 359.33 | 340.66 | 324.33 | 315.00 | 311.49 | 333.67 | 397.83 | 583.33 |
| 3.3 | 326.67 | 306.83 | 289.33 | 274.16 | 264.83 | 261.33 | 281.17 | 329.00 | 432.83 |
| 3.2 | 277.67 | 258.99 | 242.66 | 227.49 | 218.17 | 216.99 | 234.50 | 271.83 | 330.17 |
| 3.1 | 228.67 | 212.33 | 197.16 | 184.33 | 175.00 | 176.16 | 192.50 | 220.50 | 256.67 |
| 3.0 | 179.67 | 165.66 | 152.83 | 141.16 | 133.00 | 136.49 | 154.00 | 175.00 | 198.33 |
| 2.9 | 129.50 | 118.99 | 110.83 | 100.33 | 93.33 | 99.16 | 117.83 | 154.00 | 148.17 |
Table 4: Remaining Li+ Capacity in mAH vs. Voltage and Temperature (0.7C Discharge Rate)
| Voltage (V) | Temperature (°C) | ||||||||
| 60 | 50 | 40 | 30 | 20 | 10 | 0 | -10 | -20 | |
| 4.1 | ? | ? | ? | ? | ? | ? | ? | ? | ? |
| 4.0 | ? | ? | ? | ? | ? | ? | ? | ? | ? |
| 3.9 | 1157.34 | 1148.00 | 1129.34 | 1082.67 | 1036.00 | ? | ? | ? | ? |
| 3.8 | 980.00 | 989.33 | 1026.67 | 1045.34 | 1008.00 | 924.00 | 672.00 | ? | ? |
| 3.7 | 756.00 | 774.67 | 830.67 | 933.34 | 961.33 | 914.67 | 668.83 | 214.67 | ? |
| 3.6 | 588.00 | 588.00 | 616.00 | 746.67 | 868.00 | 896.00 | 665.75 | 212.80 | ? |
| 3.5 | 494.67 | 485.33 | 494.67 | 560.00 | 700.00 | 877.33 | 662.67 | 210.94 | 37.33 |
| 3.4 | 420.00 | 410.67 | 410.67 | 438.67 | 513.33 | 830.67 | 648.67 | 209.07 | 35.46 |
| 3.3 | 354.67 | 345.33 | 345.33 | 354.67 | 392.00 | 653.33 | 634.67 | 207.21 | 33.60 |
| 3.2 | 298.67 | 289.33 | 289.33 | 298.67 | 317.33 | 457.33 | 611.34 | 205.34 | 31.73 |
| 3.1 | 242.67 | 242.67 | 242.67 | 242.67 | 252.00 | 317.33 | 588.00 | 186.67 | 29.87 |
| 3.0 | 196.00 | 196.00 | 196.00 | 186.67 | 196.00 | 233.33 | 420.00 | 177.34 | 28.00 |
| 2.9 | 158.67 | 149.33 | 149.33 | 149.34 | 149.33 | 168.00 | 289.33 | 163.34 | 18.66 |

Figure 3. Li+ maximum error (%) for different discharge rates and temperature ranges.
This error can be corrected by the system if the cell's temperature and discharge rate are known. However if those measurements are included, the process becomes more complicated and expensive than a coulomb counting approach and does not provide any significant advantages. Please refer to Dallas Semiconductor's application note AN131 "Li+ Fuel Gauging with Dallas Semiconductor Devices" for information on how to increase the accuracy of Dallas coulomb counting devices even further. Contact Battery Management Marketing for a copy of the document.
Data for this experiment was collected from a 4/3A size Nickel-Metal Hydride cell with a rated capacity of 3500mAH and a 4/3A size Lithium-Ion cell with a rated capacity of 1250mAH. The NiMH cell was charged with a 1C rate at ambient temperature until the cell's voltage fell 3mV from the peak value. The Li+ was charged at a 1C rate until a cell voltage of 4.2 was attained. Charging was completed at a constant 4.2 volts until the charge current fell below C/20 or 70mA. During discharge at various rates and temperatures the cells' voltage levels were recorded at 30-second intervals. The NiMH cell was considered fully discharged at 1.0 volts and the Li+ at 2.5 volts. Measurements were taken with a Keithley 2304A DVM/power supply. The cells' temperature was regulated with a Tenney environmental chamber.
 電子發燒友App









評論