matlab數值仿真
10.1知識要點與背景: 單自由度阻尼系統
2.觀察程序
zxy10_1.m (圖10.1(a))
【 clear;clf; global c w
x0(1)=1;x0(2)=0;w=10;n=3;tspan=linspace(0,4,100);cc=[0.1 0.4 0.7 1];
xx=[];hold on,,xlabel('t'),ylabel('x'),
for i=1:length(cc);
c=cc(i);
[t,x]=ode45('zxy10_1f ',tspan,x0); %求微分方程的數值解。
xx=[x(:,1),xx];
text(t(10),x(10,1),['\leftarrow c=',num2str(c)],'fontsize',15)
plot(t,x(:,1)),
end 】
zxy10_1f.m od45指令中的微分方程組函數子程序
【 function dx=zxy10_2f(t,x)
global c w
u=0;dx=zeros(2,1);
dx(1)=x(2);dx(2)=u-c*w*x(2)-w^2*x(1); 】
zxy10_2.m (圖10.1(b))
【 global c w
x0(1)=1;x0(2)=0;w=10;n=3;tspan=linspace(0,4,1500);cc=1:-1/10:0;
xx=[];
for i=1:length(cc);
c=cc(i);
[t,x]=ode45('zxy10_2f',tspan,x0); xx=[x(:,1),xx];
end
animinit('one'); %逐條觀察振動圖形。
for i=1:length(cc)
c=cc(i)
plot3(t,c*ones(length(t),1),xx(:,i),'r:'),hold on,
view(30,60); %適當選擇觀察角度(請查閱該指令的幫助,了解用法)。
comet3(t,c*ones(length(t),1),xx(:,i)),axis([ 0 4 -0.2 1.2 -1.1 1.1])
end 】
10.2.2振動彈簧的實時動畫
zxy10_2.m
【 animinit('onecart1 Animation')
axis([-2 6 -10 10]); hold on; u=2;
xy=[ 0 0 0 0 u u u+1 u+1 u u;
-1.2 0 1.2 0 0 1.2 1.2 -1.2 -1.2 0];
x=xy(1,:);y=xy(2,:);
% Draw the floor under the sliding masses
plot([-10 20],[-1.4 -1.4],'b-','LineWidth',2);
hndl=plot(x,y,'b-','EraseMode','XOR','LineWidth',2);
set(gca,'UserData',hndl);
for t=1:0.025:100;
u=2+exp(-0.00*t)*cos(t);
x=[0 0 0 0 u u u+1 u+1 u u];
hndl=get(gca,'UserData');
set(hndl,'XData',x);
drawnow
end 】
10.3.3物理問題的數值模擬
下面列舉兩個物理模擬的例子,用Matlab模擬它們是十分有趣的。
1.多普勒效應的模擬
【 x0=500;v=60;y0=30;c=330;w=1000;t=0:0.001:30;
r=sqrt((x0-v*t).^2+y0.^2);t1=t-r/c;
u=sin(w*t)+sin(1.1*w*t);u1=sin(w*t1)+sin(1.1*w*t1);
sound (u);pause (5),sound (u1) 】
2. 用image指令模擬 兩點(雙縫)光干涉圖案
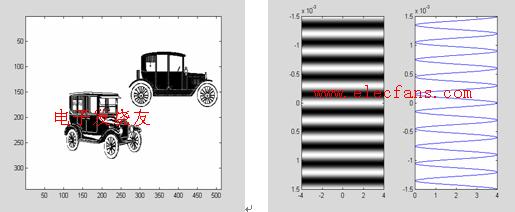
◆觀察:讀取Matlab中的mpgcover.jpg圖形文件并畫出。
【 clf,A=imread('mpgcover','jpg');image(A) 】
雙縫干涉參考程序
zxy10_6.m
【 Lamda=0.0000006;d=2;z=1000; ymax=5*Lamda*z/d;n=1000;
x=[0,4];y=[-ymax,ymax]; %設定屏幕。
ys=linspace(-ymax, ymax, n);L1=sqrt((ys-d/2).^2+z^2);
L2=sqrt((ys+d/2).^2+z^2);Phi=2*pi*(L2-L1)/Lamda;B=4*cos(Phi/2).^2;
clf;figure(gcf);NCLevels=255;Br=(B/4.0)*NCLevels;Br=Br';
subplot (1,2,1),image(x,y, Br);colormap(gray(NCLevels));
%colormap('default');
%colormap('hot');
Subplot(1,2,2),plot(B,ys) 】

圖10.16.讀取圖形文件并畫出 圖10.17.雙縫干涉的模擬
 電子發燒友App


評論